Machine Debuggers & Open Process Surgery
Contents
15. Machine Debuggers & Open Process Surgery#
While you may be familiar with debuggers and their use to find bugs in Java or python code there is much more to them than meets the eye.
There are low-level-debuggers that are designed and built to allow you to inspect and control the cpu and memory of a process, giving you direct access to the inner binary works of the computer and your code while it is running. In addition, low-level-debuggers may simultaneously let you work symbolically (with the source code of the program being debugged). This lets you both see what is going on in the CPU and memory and how this relates to the original ASCII source files you wrote to create the binary being run in the process. In our case the source files will be assembly source at first and then C later. Regardless using the underlying view of the CPU and memory will reveal what is really going on.
|
While they can seem intimidating at first such low-level debuggers are incredibly powerful tools that help us freeze, dissect and modify a running program. In some sense they let us conduct surgery on a process. In doing so the anatomy of the hardware and software are laid bare for us to see and manipulate.
Like the shell the debugger, GDB, that we will use has a some what cryptic terminal interface with a some times strange command syntax. But like the shell once you get over the initial learning curve you will find the power you have at your fingertips to be quite remarkable.
|
GNU Debugger (gdb) is the debugger we will use as it is the default debugger available on Linux. GDB was originally modeled after XDB from the BSD family of UNIX systems. To make our lives a little easier we will use the built in support gdb has for text windowed interface called TUI. The TUI mode will allow us to split the terminal interface of gdb into multiple portions in which we can keep a constant eye on information like the cpu registers while we issue commands. One can start gdb in tui mode in three ways: 1) use
gdbtuias a shotcut for 2) starting gdb with the tui flaggdb -tuiand 3) switching into tui mode after you started gdb in its default nontui mode eg. issuegdbto start it in its default mode and then issue the following command to gdb to switch into tui modetui enable(similarly you can switch out of tui mode vaitui disable).
From here on in we will use gdb as our working choice but it is worth remembering that the concepts we talk about are applicable to other debuggers like xdb and lldb.
15.1. Overview#
|
Let’s begin with an overview of the relationship between the debugger and the process we want to debug running a particular binary executable.
There are three basic way of setting up this relationship:
Start gdb, tell it what executable we want to work with, at this point it will let us explore the executable but it will not start a new running instants of it. Then give gdb a command to start the specified executable as a process that is under gdb’s control. Now we can explore and manipulate this new process created from the executable.
Start gdb and tell it to attach to an existing running process. Here one will need to know the process identifier (pid) of the existing process which can be obtained with the ‘ps’ command. Once attached we can explore and control the process and the explore the binary the process was started from. See attaching for more info.
The final option is more advanced and uses features of gdb to communicate with “remote” programs or computers that are not under the control of the OS kernel that gdb is running on. This allows one to setup environments where it is possible to use gdb to explore and debug programs running on remote computers or new computer hardware that does not have an OS. See remote debugging for more information.
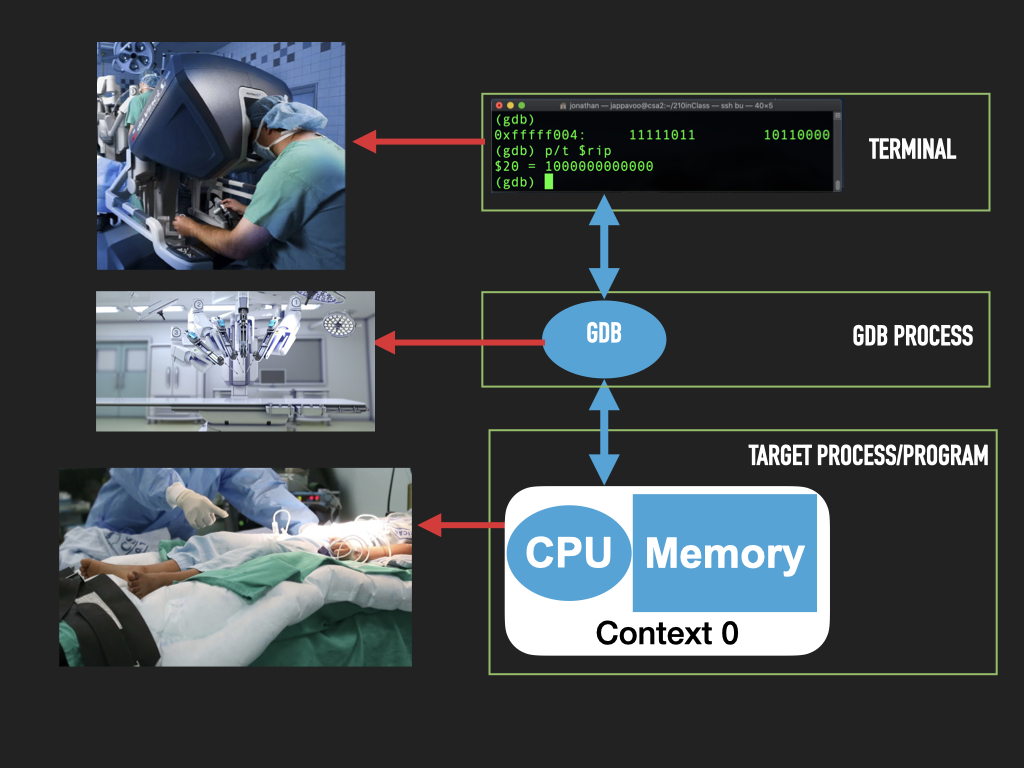
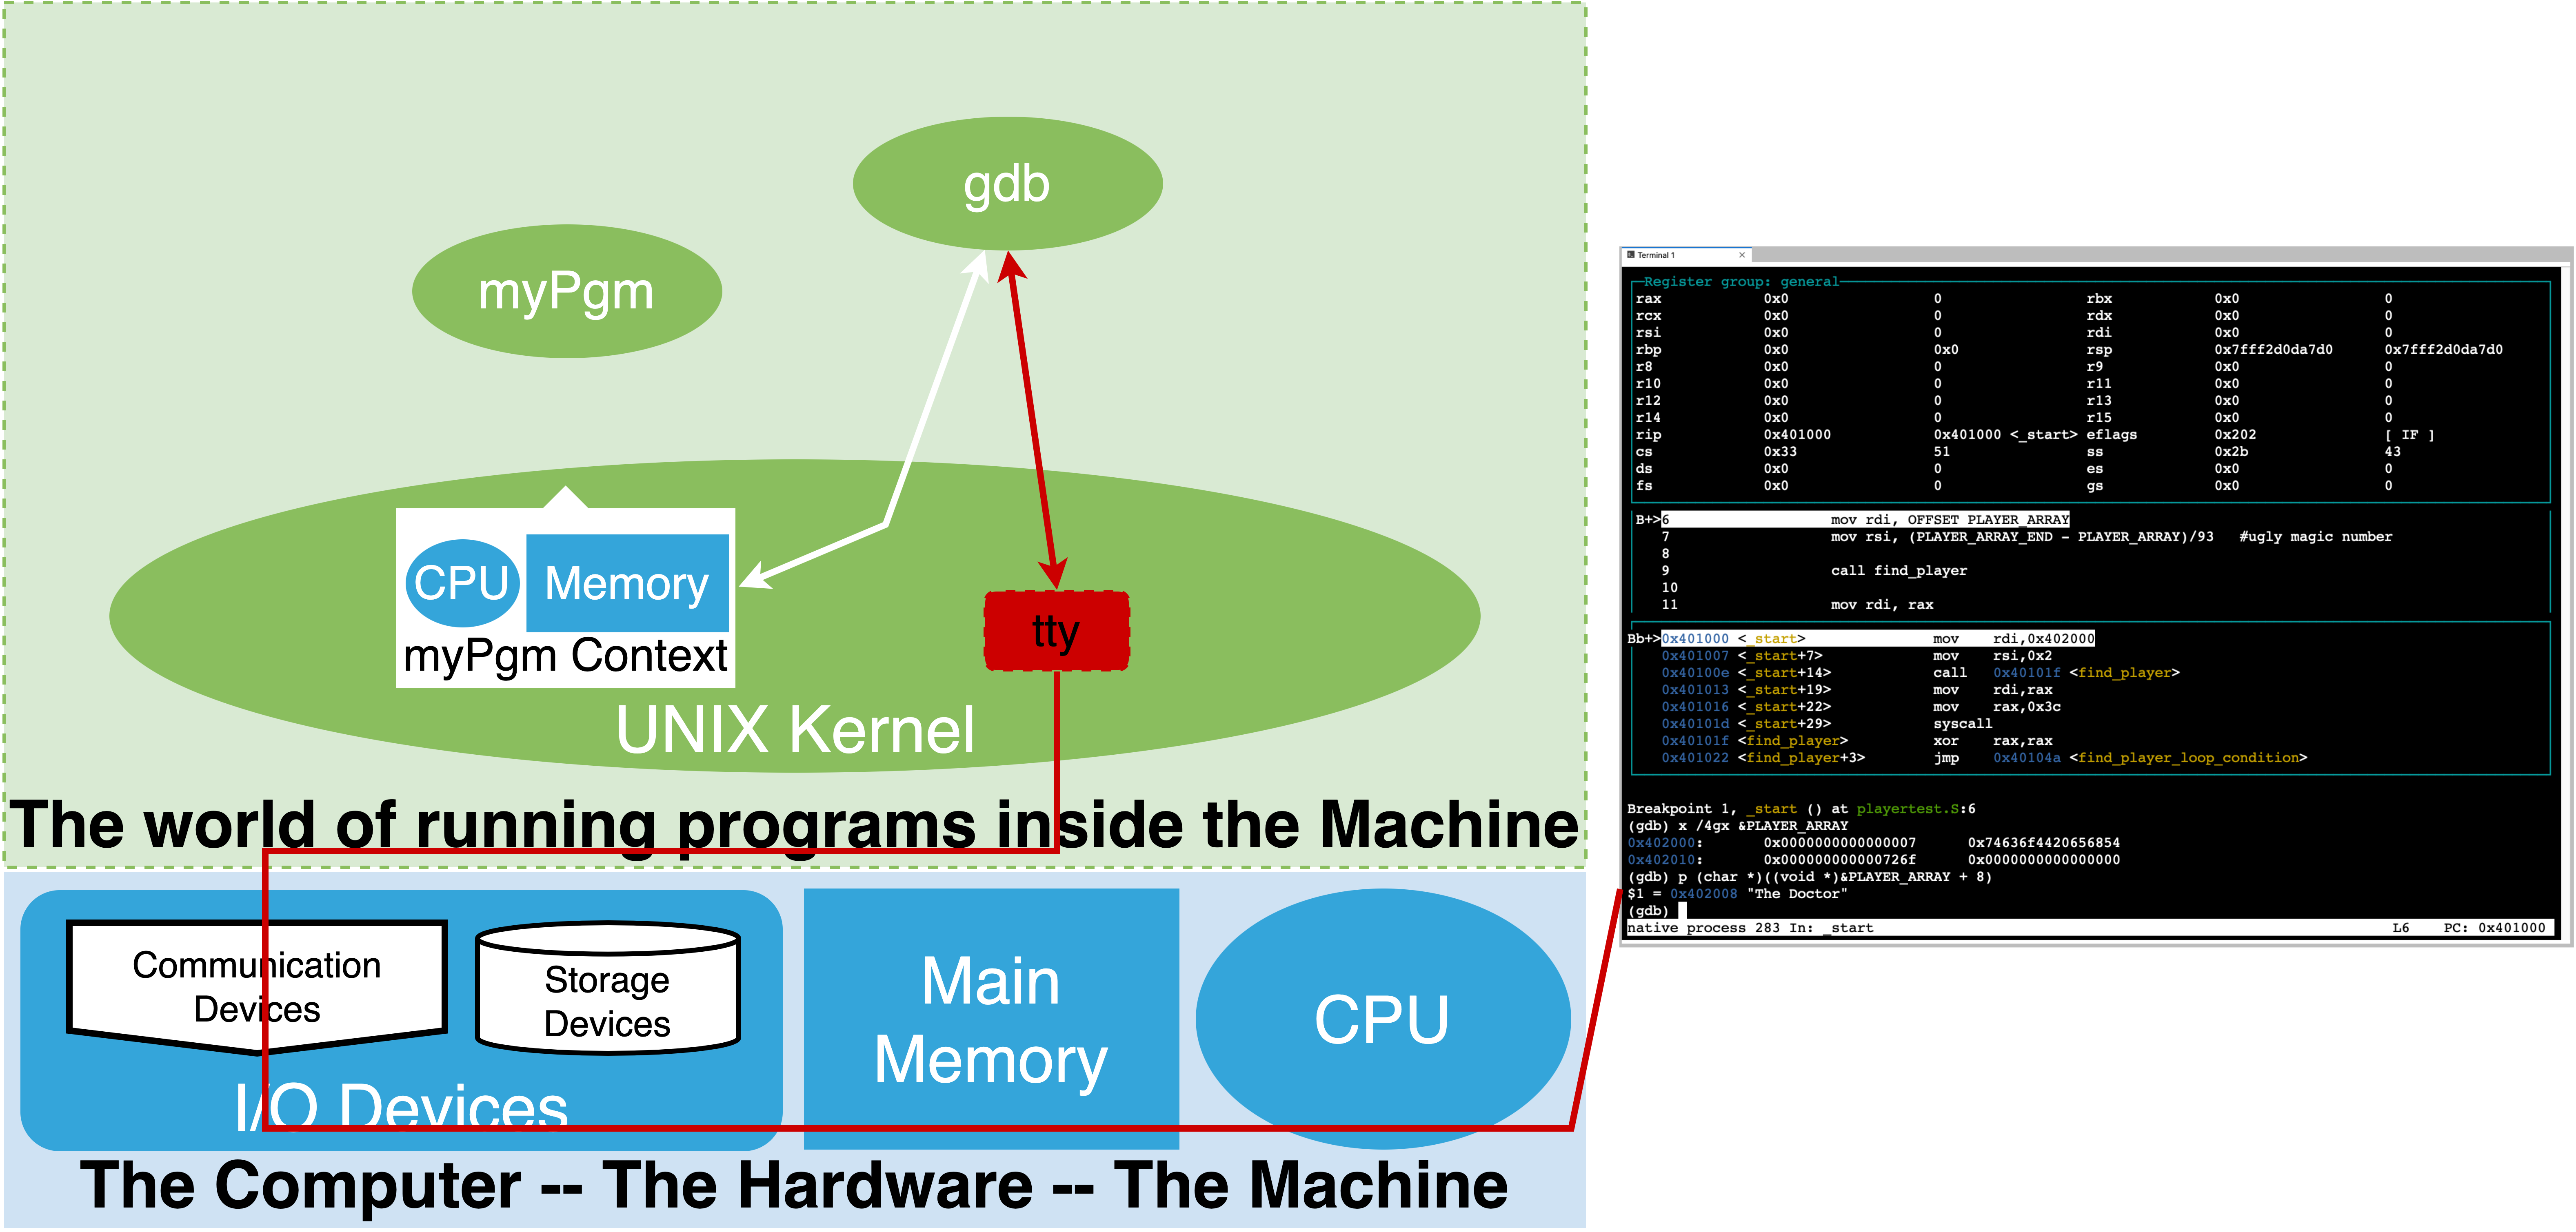
The first approach is the most common and the one we will focus on. The above figure illustrates the running relationship that we setup.
As a illustrated gdb is a separate process that we interact with. It uses the OS to access the binary and the target or “inferior” process that we start from the binary (myPgm).
There are four key things that gdb provides us:
The ability to control the cpu loop of the target process. That is to say we can cause it to stop, execute a single iteration (step a single machine instruction), or have it run normally. Further we can go back and forth between these modes of operation.
It lets us inspect and set the raw binary values of the cpu registers and memory locations of the target process.
gdbknows about the cpu we are running on and let’s us use commands that name the cpu registers so that we can print their current values and change them. Similarly it lets us display and set the values of memory locations. In this case we specify the starting address, the size of the unit we want to display and the number of such units. Eg we want to display memory values starting at address 0x4938f80 in units of 4 bytes (each unit of 4 bytes are shown as a single value) and we want to see 16 units. The syntax for changing values in memory is a little more complex as it borrows syntax for the C programming language.A very important aspect of gdb is that it has built in knowledge of various binary information representation encodings. As such gdb will let us display and set values using various formats including; binary, hexadecimal, unsigned integers, 2’s complement signed integers, floating point and others. Perhaps one of the most important encoding it knows is the CPU’s opcode to assembly mnemonics. This means we can ask gdb to reverse what the assembler did. Eg it can disassemble memory values and show us the assembly instructions mnemonics that it corresponds to. It is important to note this is not the source code we wrote (even if what we wrote was assembly). Rather this is gdb’s ability to tell us how the processor will interpret an area of memory as instructions if we were to try and execute that area. This is very powerful as we will see later.
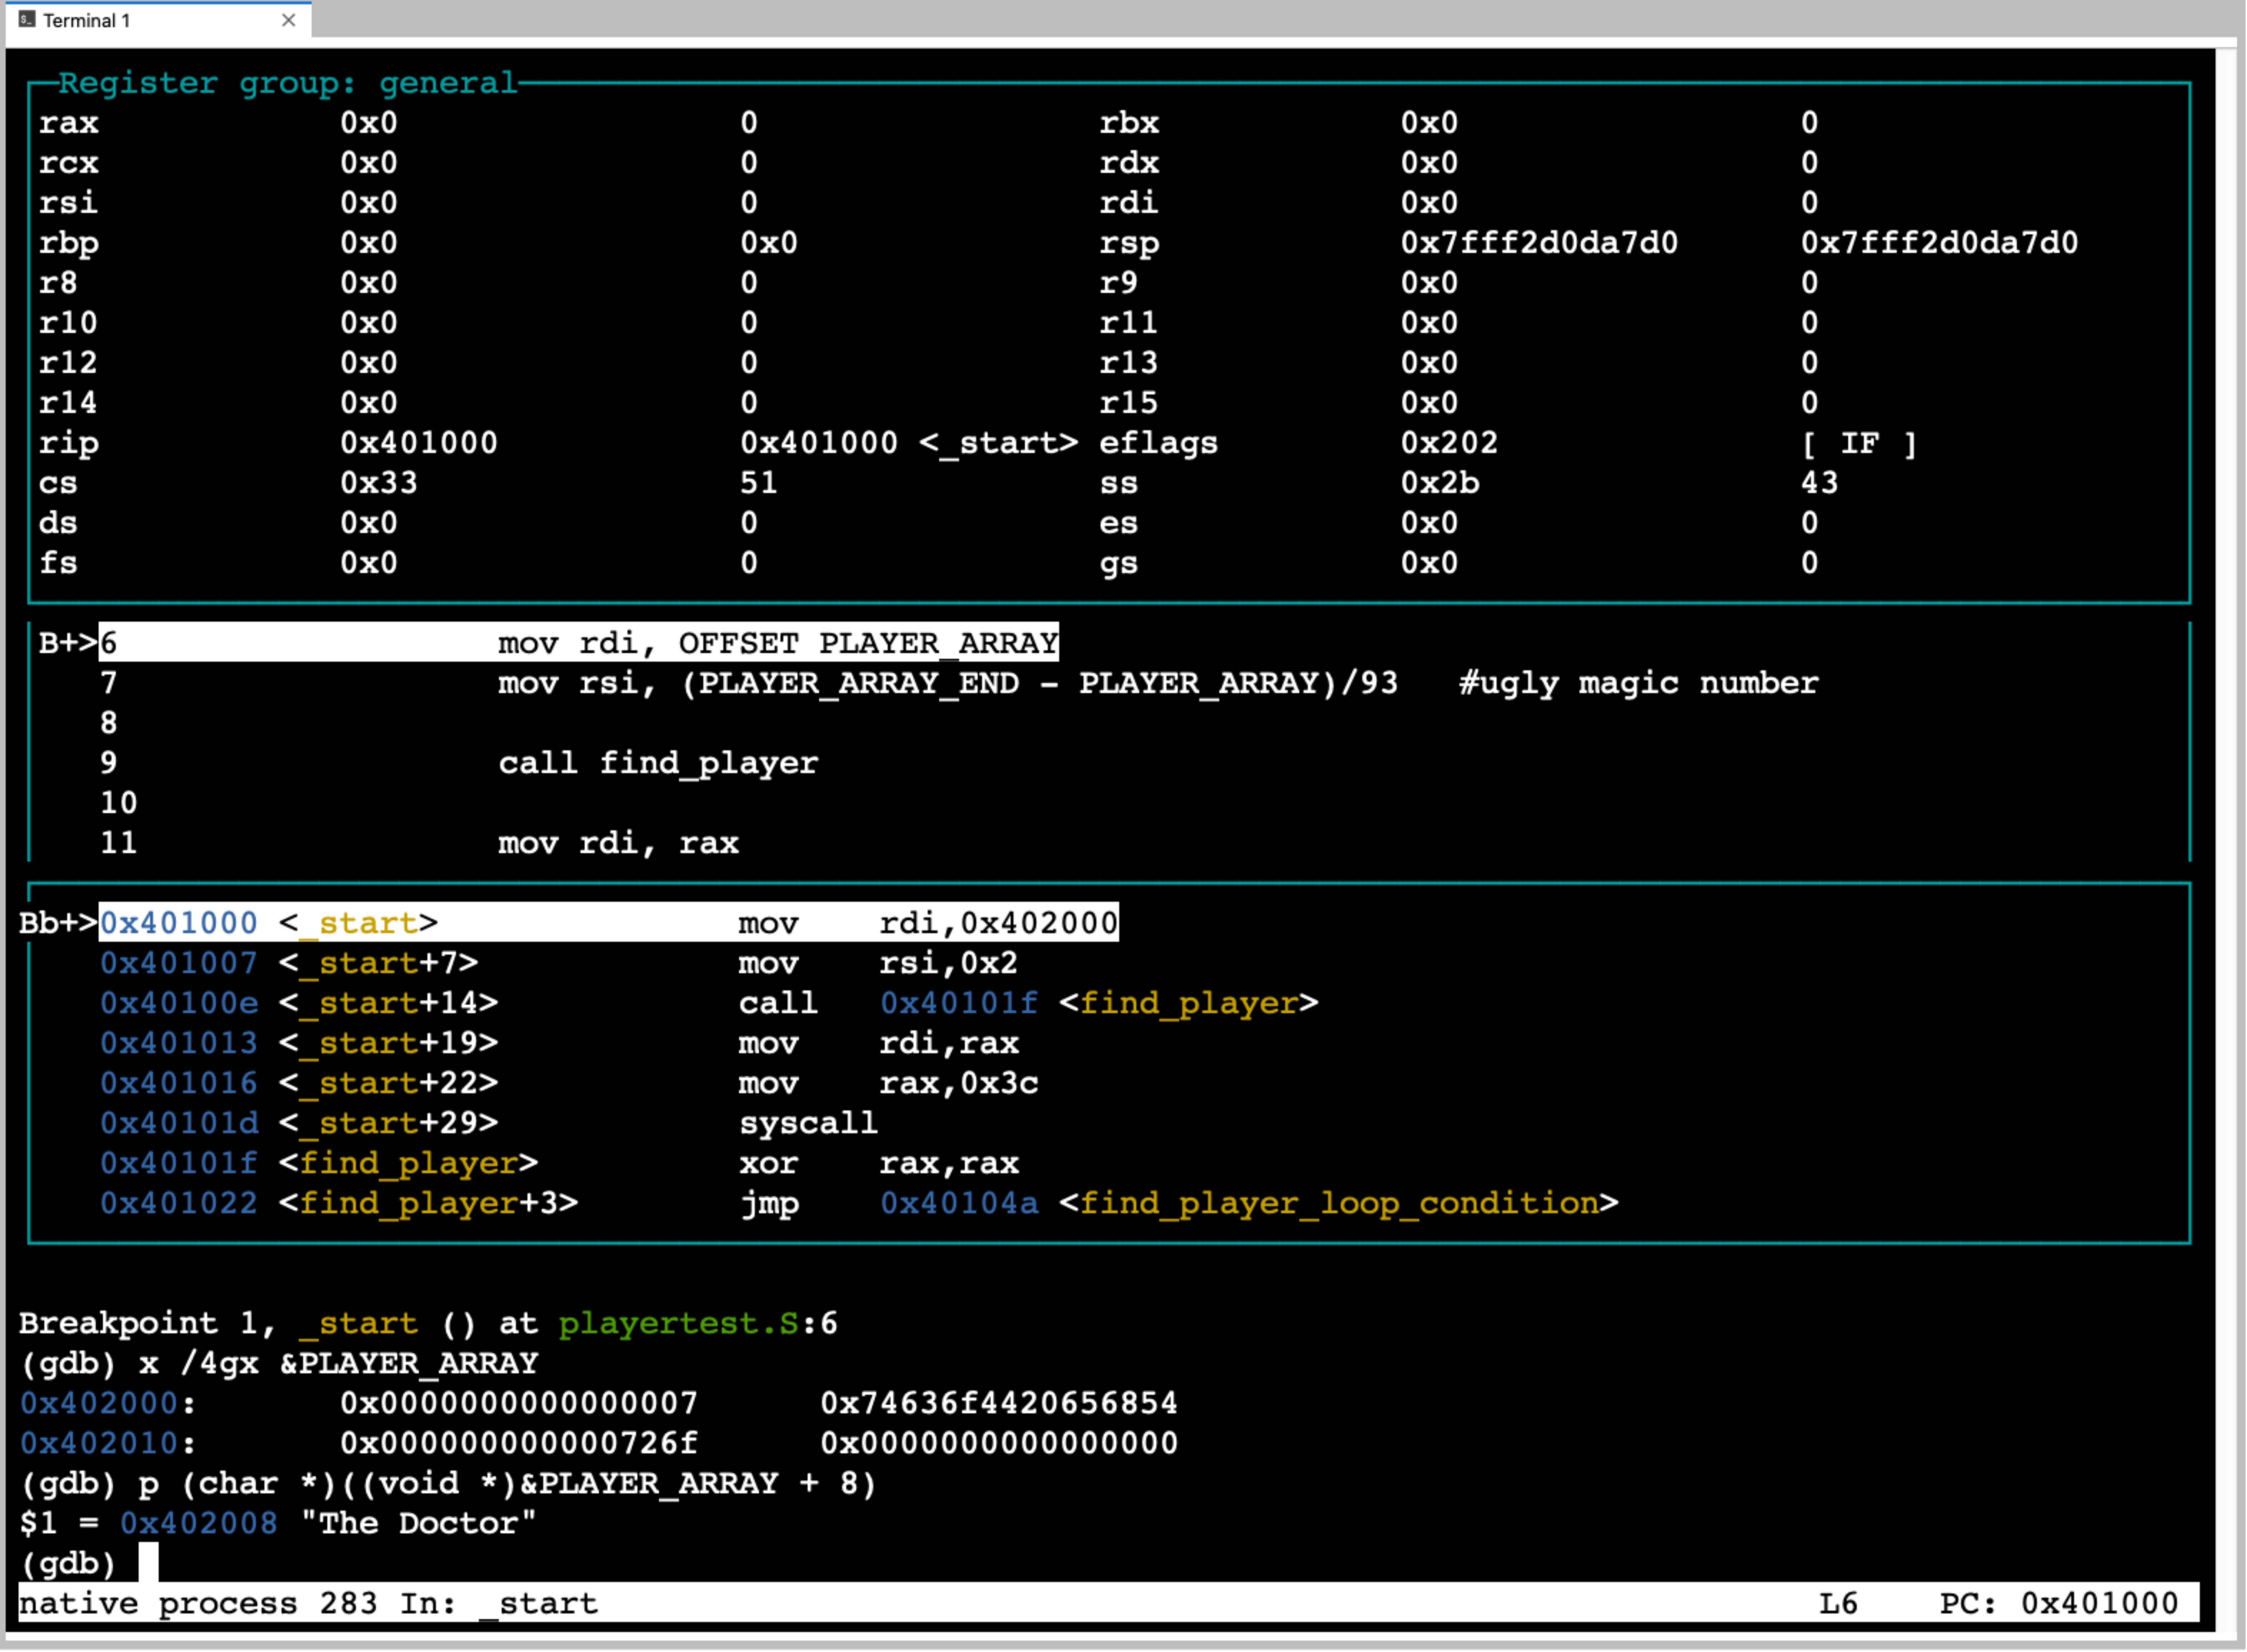
Finally the other really power thing that gdb can do is read information that the tools that converted our source code into the executable binary left in it. Specifically information that encodes how the memory addresses of the binary correspond to our source code. This allows gdb to let us name and view memory in terms of what we wrote at the source level. Eg. rather than needing to know what address a variable of our program got mapped to we can simply use the symbolic name from our program source (‘PLAYER_ARRAY’) and gdb will look up in the binary the information required to know where in memory it is (how big it is, it’s default encoding) and let use see the value of the bytes at the associated address, this way can ask to see the value of a variable by it name. This makes it feel like we are working with source code and not memory. Similarly gdb lets us list the lines of our source code and reference line numbers while it uses the information in the binary, that the assemble and complier left, to figure out what the address of the corresponding instructions in memory are. We can then control the cpu execution by source lines rather than instructions. Additionally, using the information in the binary it can know where and how many machine instructions to execute for a particular source line. This means we can see execution in context of positions in the files we wrote rather than strange looking memory addresses. In assembly source the number of instructions each source line
stepwill be obvious as we wrote our source in terms of individual instructions but when we use a high level language like C this will not be true. This source/symbolic support is very important as gdb lets us work at the “source” level of our program and yet view the machine level of the process simultaneously.

In some sense a debugger like gdb lets us get a similar level of access to a running process that the SOL6502 provides albeit without the animation of the inners workings of each instruction. But stop and think of what that means you now have the ability to look right into the binary heart of real running programs, understand it and even change it.
From here on our primary tools and working organization will be:
A terminal in which we run our editor of choice to write our source code.
A terminal where we run gdb in to explore the a process we create from our binaries.
A terminal where we will run a shell to issue commands to assemble and link our source into binaries (usually using make to automate these steps).
Oh and maybe one more terminal for the man pages ;-)
15.2. Getting Started with gdb#
15.3. Exercises#
display(HTML('''
<iframe src="https://jappavoo.github.io/SOL6502/asciinema/atest.html", height="600x" width="100%"></iframe>
'''))